


Oil, Gas and petrochemicals
Thousands of data points, charted into easy to understand visuals. You can trend, track and compare global crude petroleum trade, production and usage.
Tools:
======
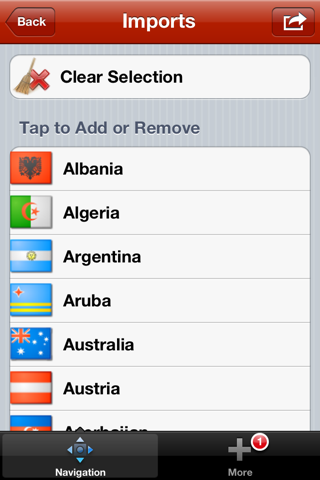
Compare unlimited countries over time by simply clicking their flags
6 different chart types
3D options for Pie charts
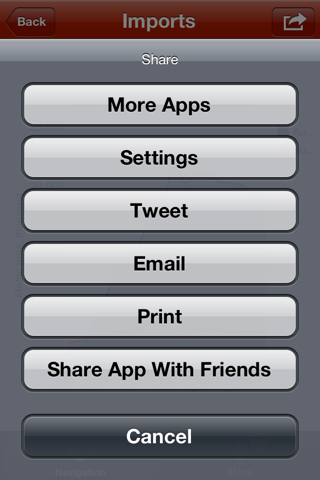
Export your custom charts for use in other projects
Email charts
Rotate and render
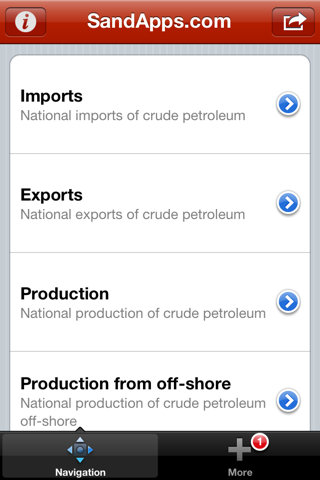
Reports Groups:
===============
National imports of crude petroleum
National exports of crude petroleum
National production of crude petroleum
National production of crude petroleum off-shore
National production of crude petroleum from oil shales
National refinery capacity
National estimated reserves from oil shale and tar sands
National estimated reserves from oil shale
National estimated reserves from tar sands
Crude petroleum transfers into the country
Changes in net stock on hard per country
Changes in net stock on hand per country at producer
Changes in net stock on hand per country at importer
Changes in net stock on hand per country at industrial consumers
Country based net transfers
Country based net inland availability
National consumption by crude petroleum fields
National consumption by energy sector
National consumption by industry & construction
National consumption by other industries and construction
National consumption by petroleum refineries
National conversion in refineries
National conversion in thermal power plants
National conversion to other forms of energy
National conversion, transport & distribution losses
Countries:
==========
All major/mid-range players
Source:
=======
Data provided by member nations to the United Nations.
Requires an active network.